By Subramanian Venkataraman & Kallol Bhaumik
ABSTRACT
Direct and indirect exposures to supply chains caused sizeable losses to credit, trading, and investment portfolios of banks due to Covid-19. In this first of its kind paper, we argue that more than data inadequacies, lack of proper tools to analyze supply chain and similar linkages as the major cause. With graph analytics, various hidden concentrations and their sources can be identified in visually appealing and robust manner. We demonstrate this with our own scenarios and computations of risks caused by each scenario. By including other types of dependencies and third-party data sets, entire limit setting, exposure monitoring and stress testing can be strengthened to a great extent.
1. Context
Concentration of exposures is a key cause of losses in credit portfolio irrespective of size, type of portfolio and geography of operations. Covid-19 led to huge losses to banks due to concentrated supply chain exposures. As per Basel Committee’s research on credit concentration[1], supply chain risk is an example of contagion due to business interconnections. In the last few years, there has been explosion of interest in graph analytics and it is making inroads in the financial services sector as a top platform for varying applications including risk management. This paper is first of its kind that tries to apply graph analytics tools to identify and manage hidden concentrations caused by supply chain linkages.
- Limitations in Credit Exposure Management</strong>
Though banks use tools such as limit setting and exposure management at various levels to keep risk concentration under control, complex nature of dependencies and interdependencies both direct and indirect, has made concentration risk increasingly difficult to manage. For example, many banks have natural exposure to supply chain through their lending, trading, investments, and other ways.
Due to risk of failure spreading from one to another, supply chain linkages among obligors makes the combined exposure higher than sum of its parts. Even supply chain linkages that obligors of a bank have with non-obligors can have cascading effect on the bank through obligors. Some of this cascading effect can also happen through second or other levels of linkages that obligors have with others. Many banks collect data on key supply chain and dependencies as part of their appraisal and monitoring processes. This does not lead to meaningful results due to inadequacies in data. More than data, current approach to analysis of these dependencies is highly inadequate and do not provide adequate insights for credit exposure management.
- Graph Analytics Based Approach
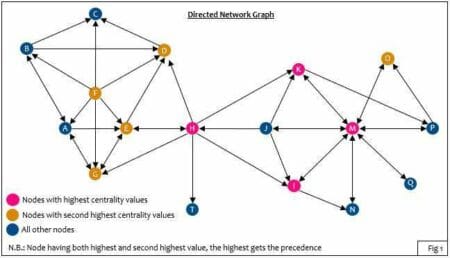
Network graph and centrality algorithms form part of graph analytics. A network graph provides a visual view of connections among various nodes. This can be used to interpret clustering of nodes, density of connection and direction (1-way or 2-way). Fig 1 depicts a directed network graph which is relevant for supply chain networks that can have dependencies on both directions.
3.1 Centrality Algorithms[2]
Centrality algorithms are leveraged to deduce relative importance of a node in a graph and provide ways for the analysts to assess the dependency risk of a supply chain. Each measure of centrality has its own unique interpretation in terms of supply chain concentration risk.
Degree centrality: It measures the number of edges ending or starting from each node of a network. In a supply chain network, a supplier is very important if it supplies to several companies instead of one. Hence outbound and inbound centrality both can play major role in identifying the most important node of the network. An obligor with either highest outbound or highest inbound degree centrality is subject to multiple cumulative chains of dependency. In risk mitigation approach, a node with highest outbound centrality carries more importance than a node with highest inbound centrality. Because highest outbound centrality node highlights the cascading effect on the other dependent nodes. It demands immediate risk mitigation control measures so that multiple cumulative dependency risk chains can also be taken care of. Unlike highest outbound centrality node, inbound centrality node is subject to multiple sources of risk. Hence its impact on other nodes is minimal. In fig 1, node M scores the highest value for both outbound and inbound centralities.
Closeness of centrality: A node with highest closeness centrality (fig 1: node I) has the shortest average distances from most nodes in a graph. In a network, an obligor with high closeness normally is part of many dependency risk chains, and it normally has a greater influence on the overall risk of dependency networks than nodes with low closeness centrality.
Betweenness centrality: A node with highest betweenness centrality (fig 1: node H) determines how much influence it has over the transition of risk from one part of the graph to another part of the graph. These nodes may not initiate cascading failures or may not be a part of a single network path with high cumulative dependency risk, but these nodes may be part of multiple risk paths and, thus, play a crucial role in the risk flow.
Eigenvector centrality: It is a natural extension of the simple degree centrality. An obligor with highest eigenvector centrality (fig 1: node M) has a high influence on other obligors. In a risk dependency graph network, obligors with high eigenvector centrality are connected to other obligors, who also have high connectivity. This is very important measure for critical infrastructure risk graphs because such obligors not only cause cascading failures to more obligors, but they may cause multiple cascading chains of high risk.
PageRank Centrality: PageRank centrality addresses the shortcoming of the eigenvector centrality. When an obligor with high eigenvector centrality is a customer of several suppliers, all the suppliers also get high centrality. In all cases this is not correct. PageRank addresses this by passing on small amount of centrality of the customer to each of these suppliers. Obligor M has the highest centrality value.